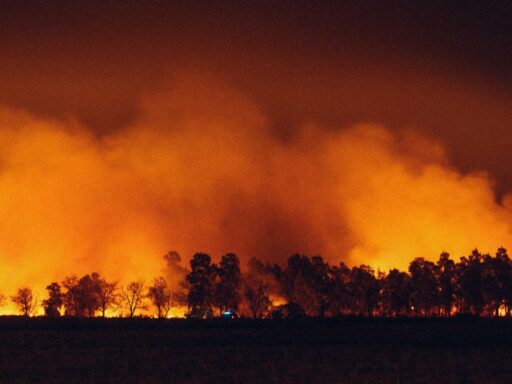
A volatile early summer storm pattern produced 51 confirmed tornadoes across several states, including a 165 mile per hour twister in Indiana that tore through homes, farms, and businesses. Packed into a single June stretch, the outbreak turned what is often a quieter severe weather window into a reminder that tornado season no longer follows tidy rules. Communities now face a long recovery while forecasters and emergency managers sift through what this barrage reveals about risk, readiness, and a changing atmosphere.
How the June tornado barrage unfolded across the Midwest
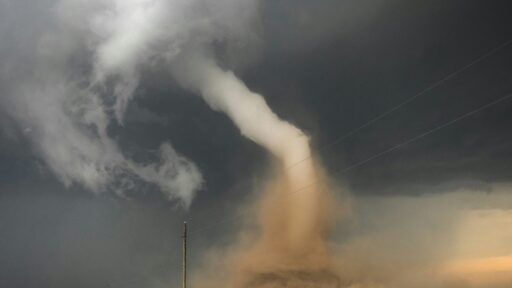
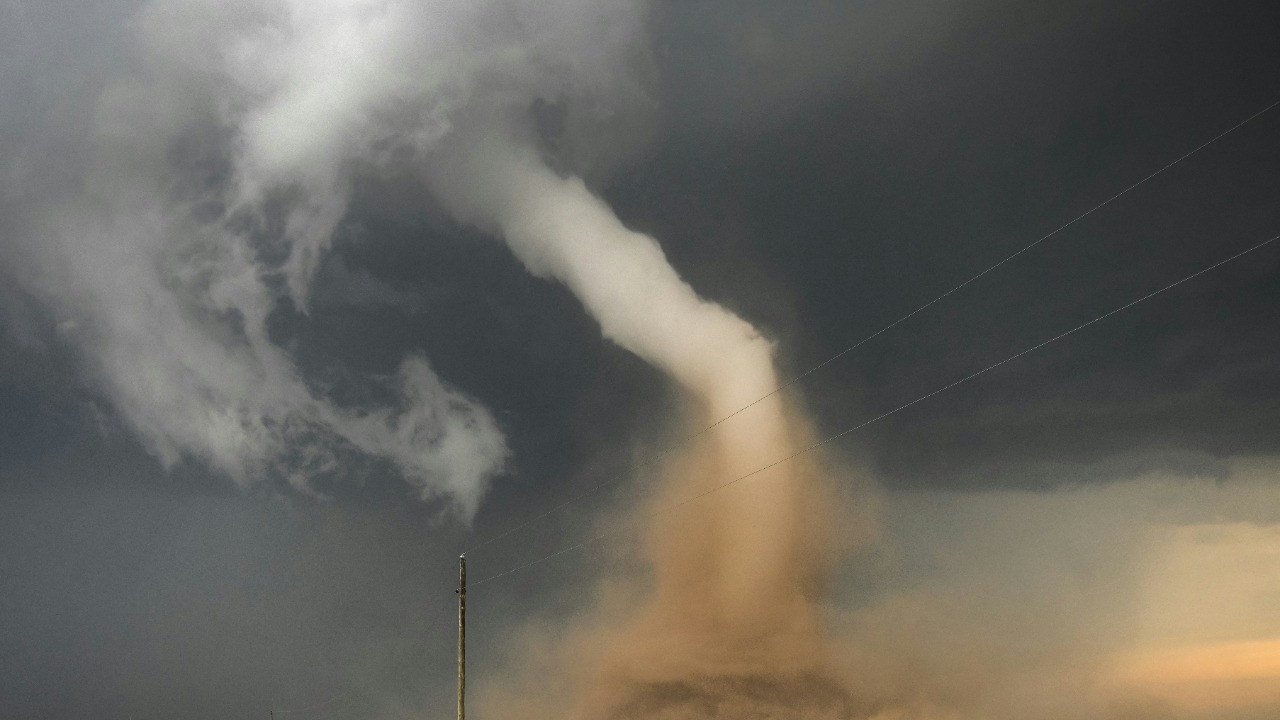
The June outbreak developed as a classic clash of air masses, with hot, humid Gulf air surging north into a corridor of stronger winds aloft. That setup allowed storms to rotate and repeatedly spin up tornadoes, leaving a swath of damage from the Plains into the Midwest. According to an analysis of storm surveys, the event produced 51 tornadoes in total, a figure more typical of a spring outbreak than an early summer pattern.
Indiana absorbed some of the worst of it. One tornado in particular reached estimated winds of 165 miles per hour, strong enough to peel roofs from well built homes, snap power poles, and toss vehicles. Survey teams rated that twister at the upper end of the EF3 range, based on structural damage and debris patterns documented in the hardest hit communities. The storm carved a path through rural areas and small towns, leaving a patchwork of destroyed houses, flattened grain bins, and mangled farm equipment that underscored how vulnerable both residents and local economies remain to high end tornadoes.
Other states also saw multiple tornadoes during the same outbreak window, with reports of funnels tracking across open fields, skirting city limits, and occasionally striking mobile home parks and industrial sites. The 51 tornado count reflects both long track, intense vortices and shorter lived spin ups that touched down briefly before dissipating. That mix is typical of a dynamic squall line and supercell combination, where some storms maintain strong, persistent rotation while others produce quick, weaker circulations embedded within broader lines of wind damage.
Radar data from the event showed several storms cycling, a process where one mesocyclone weakens as a new one forms downstream, which can lead to multiple tornadoes from a single supercell. This behavior helped inflate the overall count and complicated warning operations, since forecasters had to track rapidly evolving signatures over densely populated areas. The outbreak, documented in detail in storm survey reports, now serves as a case study in how quickly conditions can escalate once the ingredients align.
Shifting baselines: why this tornado outbreak feels different
Tornadoes in June are not unusual, but the scale and intensity of this outbreak highlight how the seasonal rhythm of severe weather is changing. Historically, the most active period for strong tornadoes in the central United States clustered in April and May. In recent years, that peak has stretched on both sides, with more significant events occurring earlier in spring and deeper into summer. The 51 tornadoes in this episode fit that emerging pattern, landing at a time when many residents had mentally moved on from the height of tornado season.
The timing matters for preparedness. Schools are out, families are traveling, and more people are outdoors at ballfields, campgrounds, and construction sites. When an EF3 strength tornado with 165 mile per hour winds barrels through during this lifestyle window, the margin for error shrinks. Sirens, phone alerts, and local broadcasters still play key roles, but reaching people who are not near televisions or may have silenced alerts becomes harder. Emergency managers in the affected counties have already flagged the challenge of warning fatigue, where a long spring of watches and warnings can lead residents to tune out just as a high end event arrives.
The outbreak also reinforces how vulnerability is distributed. The Indiana tornado that reached 165 miles per hour cut through a mix of older homes, newer subdivisions, and manufactured housing. Damage assessments show that building age, construction quality, and access to basements or interior safe rooms strongly influenced survival and injury patterns. In some neighborhoods, well anchored homes lost roofs yet preserved interior rooms, while nearby mobile homes were obliterated. That contrast is not new, but the concentration of damage in a single June event brings renewed attention to building codes, retrofit programs, and the availability of community shelters.
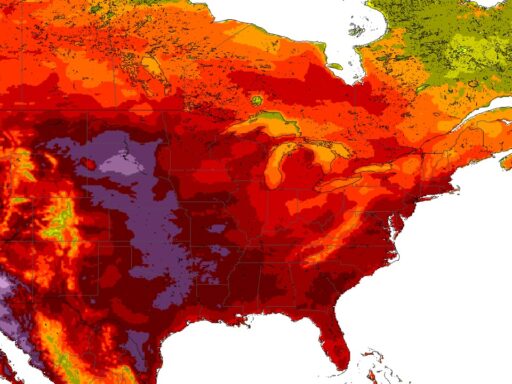
Another factor that makes this outbreak stand out is its geographic reach within a short time span. With 51 tornadoes scattered across multiple states, mutual aid resources such as utility crews, search and rescue teams, and volunteer groups were stretched. Power outages lingered longer in some rural areas because crews had to prioritize critical infrastructure and denser population centers. For residents on the edge of the grid, that meant extended periods without air conditioning in early summer heat, compounding the health risks that follow a major storm.
Why the Indiana EF3 and the 51 tornado count matter right now
The 165 mile per hour tornado in Indiana is more than a statistic. It is a vivid example of how a single storm can upend local economies and test the resilience of infrastructure. Farms in its path reported destroyed grain bins, damaged irrigation systems, and flattened crops, losses that ripple through regional supply chains. Insurance claims from that corridor alone are expected to run into the tens of millions of dollars, a burden that will influence premiums and coverage terms for years.
For state and local officials, the outbreak has sharpened debates over how to invest limited disaster mitigation funds. Some communities are weighing grants to help residents install safe rooms or retrofit garages and roof connections, while others focus on improving siren coverage and backup power for emergency operations centers. The June tornadoes provide fresh, local evidence that can drive those decisions, especially when paired with detailed damage maps and social vulnerability data.
The event also intersects with broader conversations about climate and severe weather. Scientists remain cautious about drawing direct lines between any single tornado outbreak and long term climate change, yet there is growing research into how a warmer, moister atmosphere might influence the environments that support severe storms. The 51 tornadoes in this sequence occurred in a setup rich in low level moisture and instability, conditions that some studies suggest could become more common in certain regions. While attribution remains complex, policymakers are increasingly using high impact episodes like this one to argue for both emissions reductions and adaptation measures.
At the household level, the outbreak has already changed behavior. Hardware stores in the affected Indiana counties report surging demand for weather radios, battery backups, and tie down kits. Real estate agents say more buyers now ask about basements, storm shelters, and roof age before making offers. Those shifts, though incremental, show how a single high profile outbreak can reset risk perception in ways that glossy brochures and public service announcements often cannot.
Rebuilding, rethinking, and preparing for the next outbreak
Recovery from the June tornadoes will play out over months and years. In the hardest hit Indiana communities, rebuilding decisions will determine whether residents are better protected when the next storm arrives. Some homeowners are choosing to upgrade to impact resistant shingles, reinforced garage doors, and anchored decks. Others are adding in ground or above ground safe rooms that meet tested performance standards. Local officials are encouraging those choices by streamlining permits for resilient construction and, in some cases, tying small incentives to stronger designs.
At the same time, emergency managers across the Midwest are reviewing how warnings were communicated during the outbreak. Questions on the table include whether polygon based alerts adequately captured the shifting tracks of cycling supercells, how quickly sirens were activated, and whether language in alerts clearly conveyed the severity of the 165 mile per hour tornado threat. Some agencies are exploring more aggressive use of “particularly dangerous situation” wording when radar signatures and environmental conditions point to high end events, even if confirmation from the ground is still developing.