
Europe has recorded substantial reductions in several major sources of air pollution over the past decade, demonstrating that environmental regulation, cleaner technology and changes in transport and industry can produce measurable results.
According to the latest assessment from the Copernicus Atmosphere Monitoring Service, industrial emissions of sulphur oxides fell by 59% between 2015 and 2025. Nitrogen oxide emissions from industry declined by 39% over the same period. Road transport also registered considerable progress, with nitrogen oxide emissions falling by 40% and fine particulate matter emissions dropping by 34%.
Across the European Union, emissions of sulphur oxides and nitrogen oxides have generally fallen by approximately 3% to 5% each year since 2015. These figures reflect emissions released into the atmosphere rather than identical reductions in pollutant concentrations in every town or city. Local air quality continues to vary according to traffic, industry, domestic heating, geography and weather.
Nevertheless, the overall trend provides strong evidence that coordinated clean-air policies are working.
What the 39% to 59% Reductions Actually Measure
Sulphur oxides are commonly produced when sulphur-containing fuels are burned in power plants, industrial facilities and other combustion processes. They can contribute to respiratory problems, acidification and the formation of airborne particles.
Nitrogen oxides are released by combustion sources including road vehicles, industrial machinery and energy production. They contribute to nitrogen dioxide pollution and can also help form ground-level ozone and secondary particulate matter.
PM2.5 refers to airborne particles with a diameter of 2.5 micrometres or less. These particles are small enough to penetrate deeply into the lungs and can enter the bloodstream. Their sources include combustion, road traffic, industry, residential heating and chemical reactions involving other atmospheric pollutants.
The reported improvements therefore cover several different environmental hazards rather than one general category of “toxins.” The 59% reduction applies specifically to industrial sulphur oxide emissions, while the 39% figure refers to industrial nitrogen oxides. Road emissions followed a separate pattern, with nitrogen oxides down 40% and PM2.5 down 34%.
Long-Term Regulation Is Producing Results
Europe’s progress did not come from one policy or a sudden change in public behaviour. It reflects decades of progressively stricter standards governing industrial facilities, fuels, power generation and vehicle emissions.
The European Union’s National Emission Reduction Commitments Directive establishes legally binding national targets for pollutants including nitrogen oxides, sulphur dioxide, ammonia and PM2.5. These requirements encourage member states to control pollution across transport, energy, agriculture, industry and residential heating.
The European Environment Agency’s air-pollution overview explains that the EU also operates a network of more than 4,000 monitoring stations. Their data allow authorities to compare pollution levels, identify areas exceeding legal limits and develop local air-quality plans.
Industrial improvements have included cleaner fuels, better filtration, sulphur controls and more efficient production technology. Road-transport emissions have been reduced through vehicle standards, improved engines, cleaner fuels, public transport measures and the growing use of electric and lower-emission vehicles.
Copernicus concluded that emissions are increasingly becoming separated from growth in industrial output and transport demand. In practical terms, economic activity and travel can continue without pollution increasing at the same rate.
Cleaner Emissions Are Already Producing Health Benefits
Lower emissions do not merely improve the appearance of the sky. They reduce exposure to pollutants associated with asthma, cardiovascular disease, stroke, diabetes, lung conditions and premature death.
Between 2005 and 2023, the number of deaths in the EU attributable to PM2.5 exposure fell by 57%. That meant the EU had already reached the 55% reduction target established for 2030 under its Zero Pollution Action Plan.
The achievement is considerable, but the remaining health burden is still severe. The EEA estimates that exposure above recommended levels contributed to approximately 182,000 premature deaths from PM2.5 in the EU during 2023. Nitrogen dioxide was associated with about 34,000 deaths and ozone with approximately 63,000. These figures should not simply be added together because some health impacts and exposed populations overlap.
Air pollution also carries an economic cost. The EEA’s 2026 European air-quality report cites an estimate of approximately €600 billion annually across EU member states, equivalent to about 4% of gross domestic product. The total includes healthcare costs, lost working time and other consequences of pollution-related illness.
Most Europeans Still Breathe Air Above WHO Guidelines
The encouraging reduction figures do not mean Europe’s air is now universally safe.
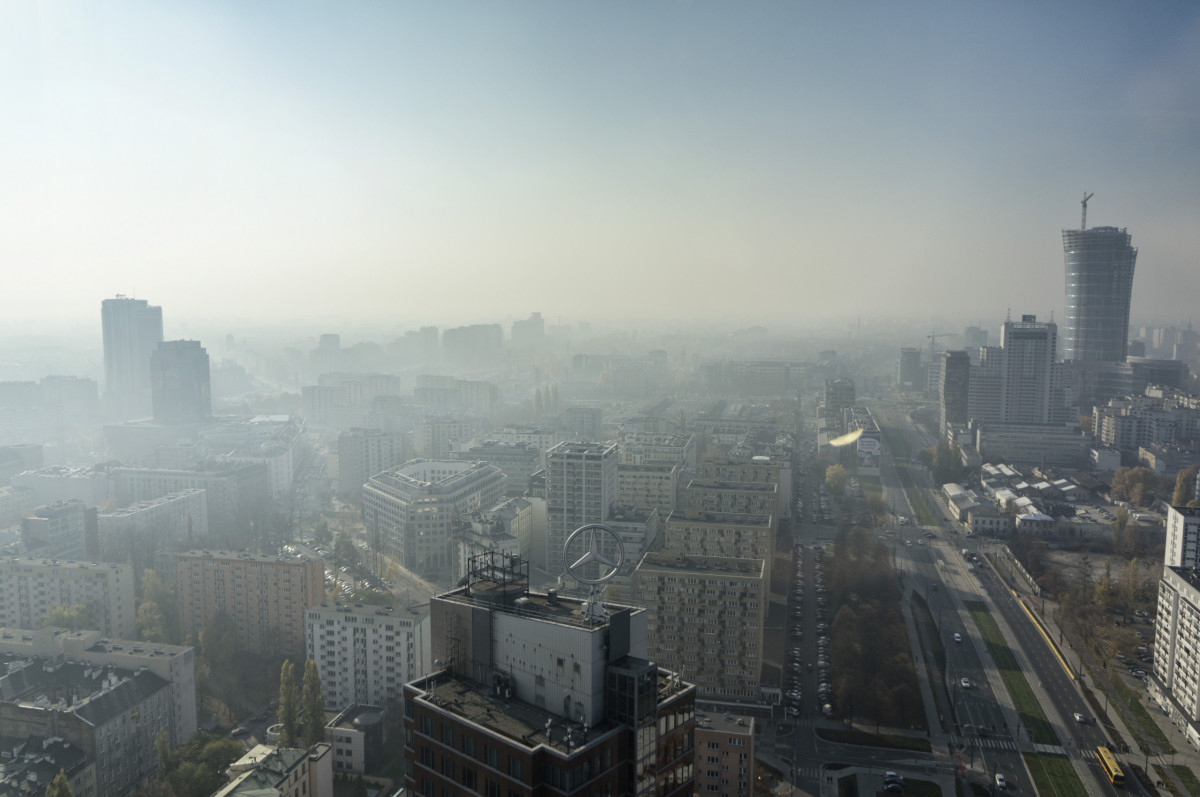
More than nine out of ten Europeans are still exposed to pollution concentrations above the health-based levels recommended by the World Health Organization. Up to 20% of monitoring stations continue to report pollution above current EU standards, particularly for PM10, ground-level ozone and benzo(a)pyrene.
The difference between EU legal standards and WHO guidelines is important. Existing EU limits have historically been less strict than the levels recommended by the WHO to protect health.
When Europe’s 2024 monitoring results were compared with WHO guidelines, only 166 of 2,223 stations recorded annual PM2.5 concentrations below the recommended level. Only 53 of 2,053 stations met the relevant ozone guideline.
The EU has adopted revised air-quality standards that will apply from 2030 and align more closely with WHO recommendations. However, more than 30% of reporting stations recorded particulate-matter concentrations above those future limits in 2024. Additional local and national measures will therefore be required before the new standards take effect.
Weather Can Temporarily Reverse the Progress
Pollution emissions may decline steadily while actual air conditions still deteriorate during particular days or seasons. Temperature, sunlight, wind and rainfall strongly influence how pollutants form, accumulate and travel.
Europe experienced several significant pollution episodes during 2025. Colder-than-average February conditions increased demand for residential heating, contributing to elevated PM2.5 levels, particularly in eastern Europe. Traffic, agriculture and industry added to the pollution during the episode.
High temperatures, strong sunlight and stagnant air encouraged ground-level ozone formation during June and August. The most significant ozone episode lasted from August 8 to August 17 and affected western, central and southern Europe.
Ground-level ozone differs from the protective ozone layer higher in the atmosphere. It forms through chemical reactions involving other pollutants in sunlight and can irritate the lungs, aggravate asthma, damage vegetation and reduce crop productivity.
Wildfires and Saharan Dust Remain Major Challenges
Record wildfires affected Portugal and Spain between August 11 and August 19, 2025. Smoke contributed to widespread exceedances of daily PM2.5 limits across parts of the Iberian Peninsula.
Copernicus researchers were able to quantify the wildfire contribution using advanced source-attribution tools. The analysis found that wildfire smoke increased surface particulate concentrations and also helped raise ozone levels in parts of Spain and Portugal.
Saharan dust created another recurring challenge. Mineral dust travelled north from Africa during several periods in 2025, increasing PM10 concentrations across southern, western and central Europe. A major March event caused numerous air-quality threshold exceedances.
These incidents illustrate why lower human-caused emissions cannot eliminate every episode of unhealthy air. Wildfires, heatwaves and long-distance dust transport can overwhelm local improvements, particularly when atmospheric conditions prevent pollution from dispersing.
Agriculture and Residential Heating Need More Attention
Industry and road transport have achieved some of Europe’s strongest reductions, but progress has been slower in other sectors.
Agriculture remains the EU’s main source of ammonia emissions, producing more than 94% of the total. Ammonia can react with other pollutants to form secondary particulate matter, making it an important contributor to PM2.5 exposure even when it is released far from cities.
Residential heating also continues to create winter pollution, particularly where homes depend on coal, wood or older solid-fuel stoves. Cleaner heating systems, improved building efficiency and stricter controls on highly polluting fuels could produce the next major reductions.
Europe’s Progress Shows That Clean-Air Policies Work
The decade-long decline in industrial and road emissions offers a positive environmental lesson. Air pollution is not an unavoidable cost of modern economic activity. Strong standards, cleaner technology, reliable monitoring and consistent enforcement can reduce it substantially.
Europe’s 39% to 59% reductions are therefore worth celebrating. They represent cleaner industrial operations, less polluting transport and fewer people exposed to some of the continent’s most harmful emissions.
The achievement should not be treated as the end of the problem. Most Europeans still breathe air exceeding WHO recommendations, and climate-related heat, wildfires and stagnant weather can create dangerous pollution even as human-caused emissions decline.
Europe has proved that the direction of travel can be changed. The next challenge is sustaining that progress while addressing agriculture, domestic heating, ozone, particulate matter and the growing effects of extreme weather.